Data Analysis Methods
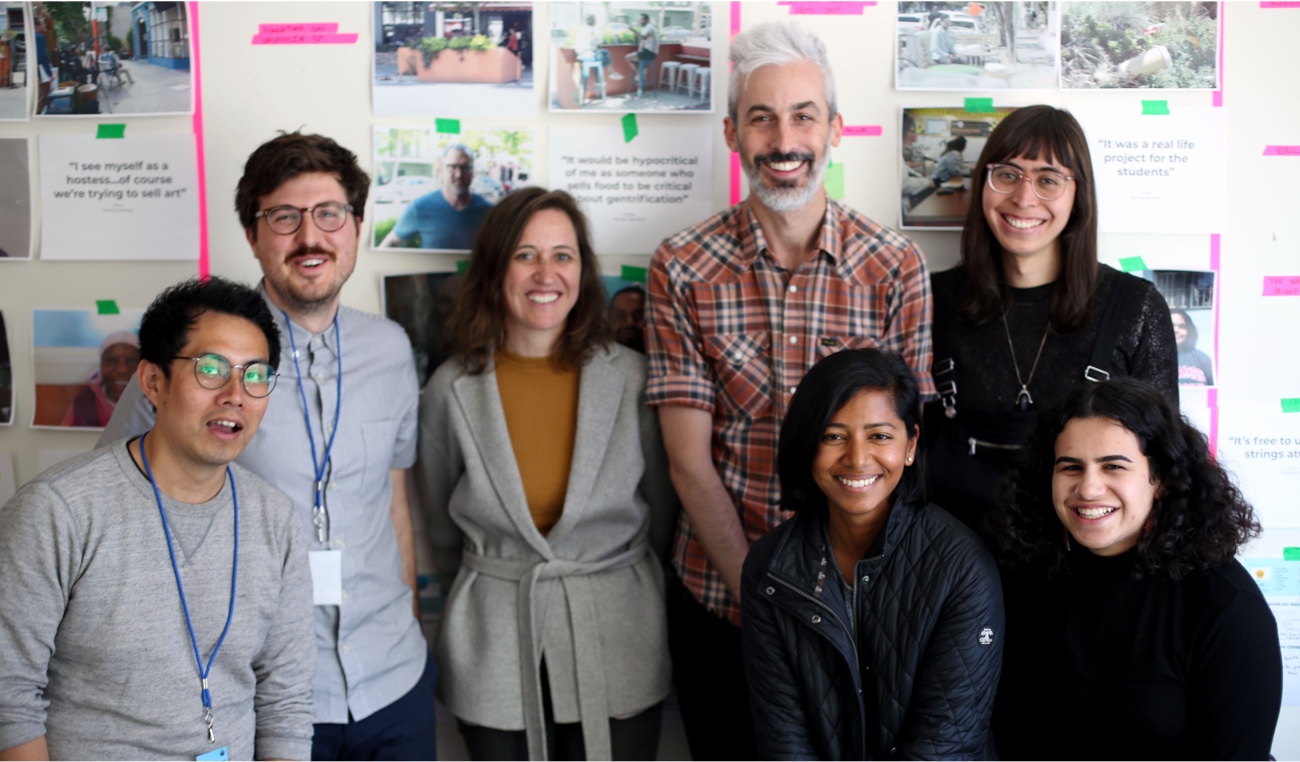
Section 1: What's a Parklet?
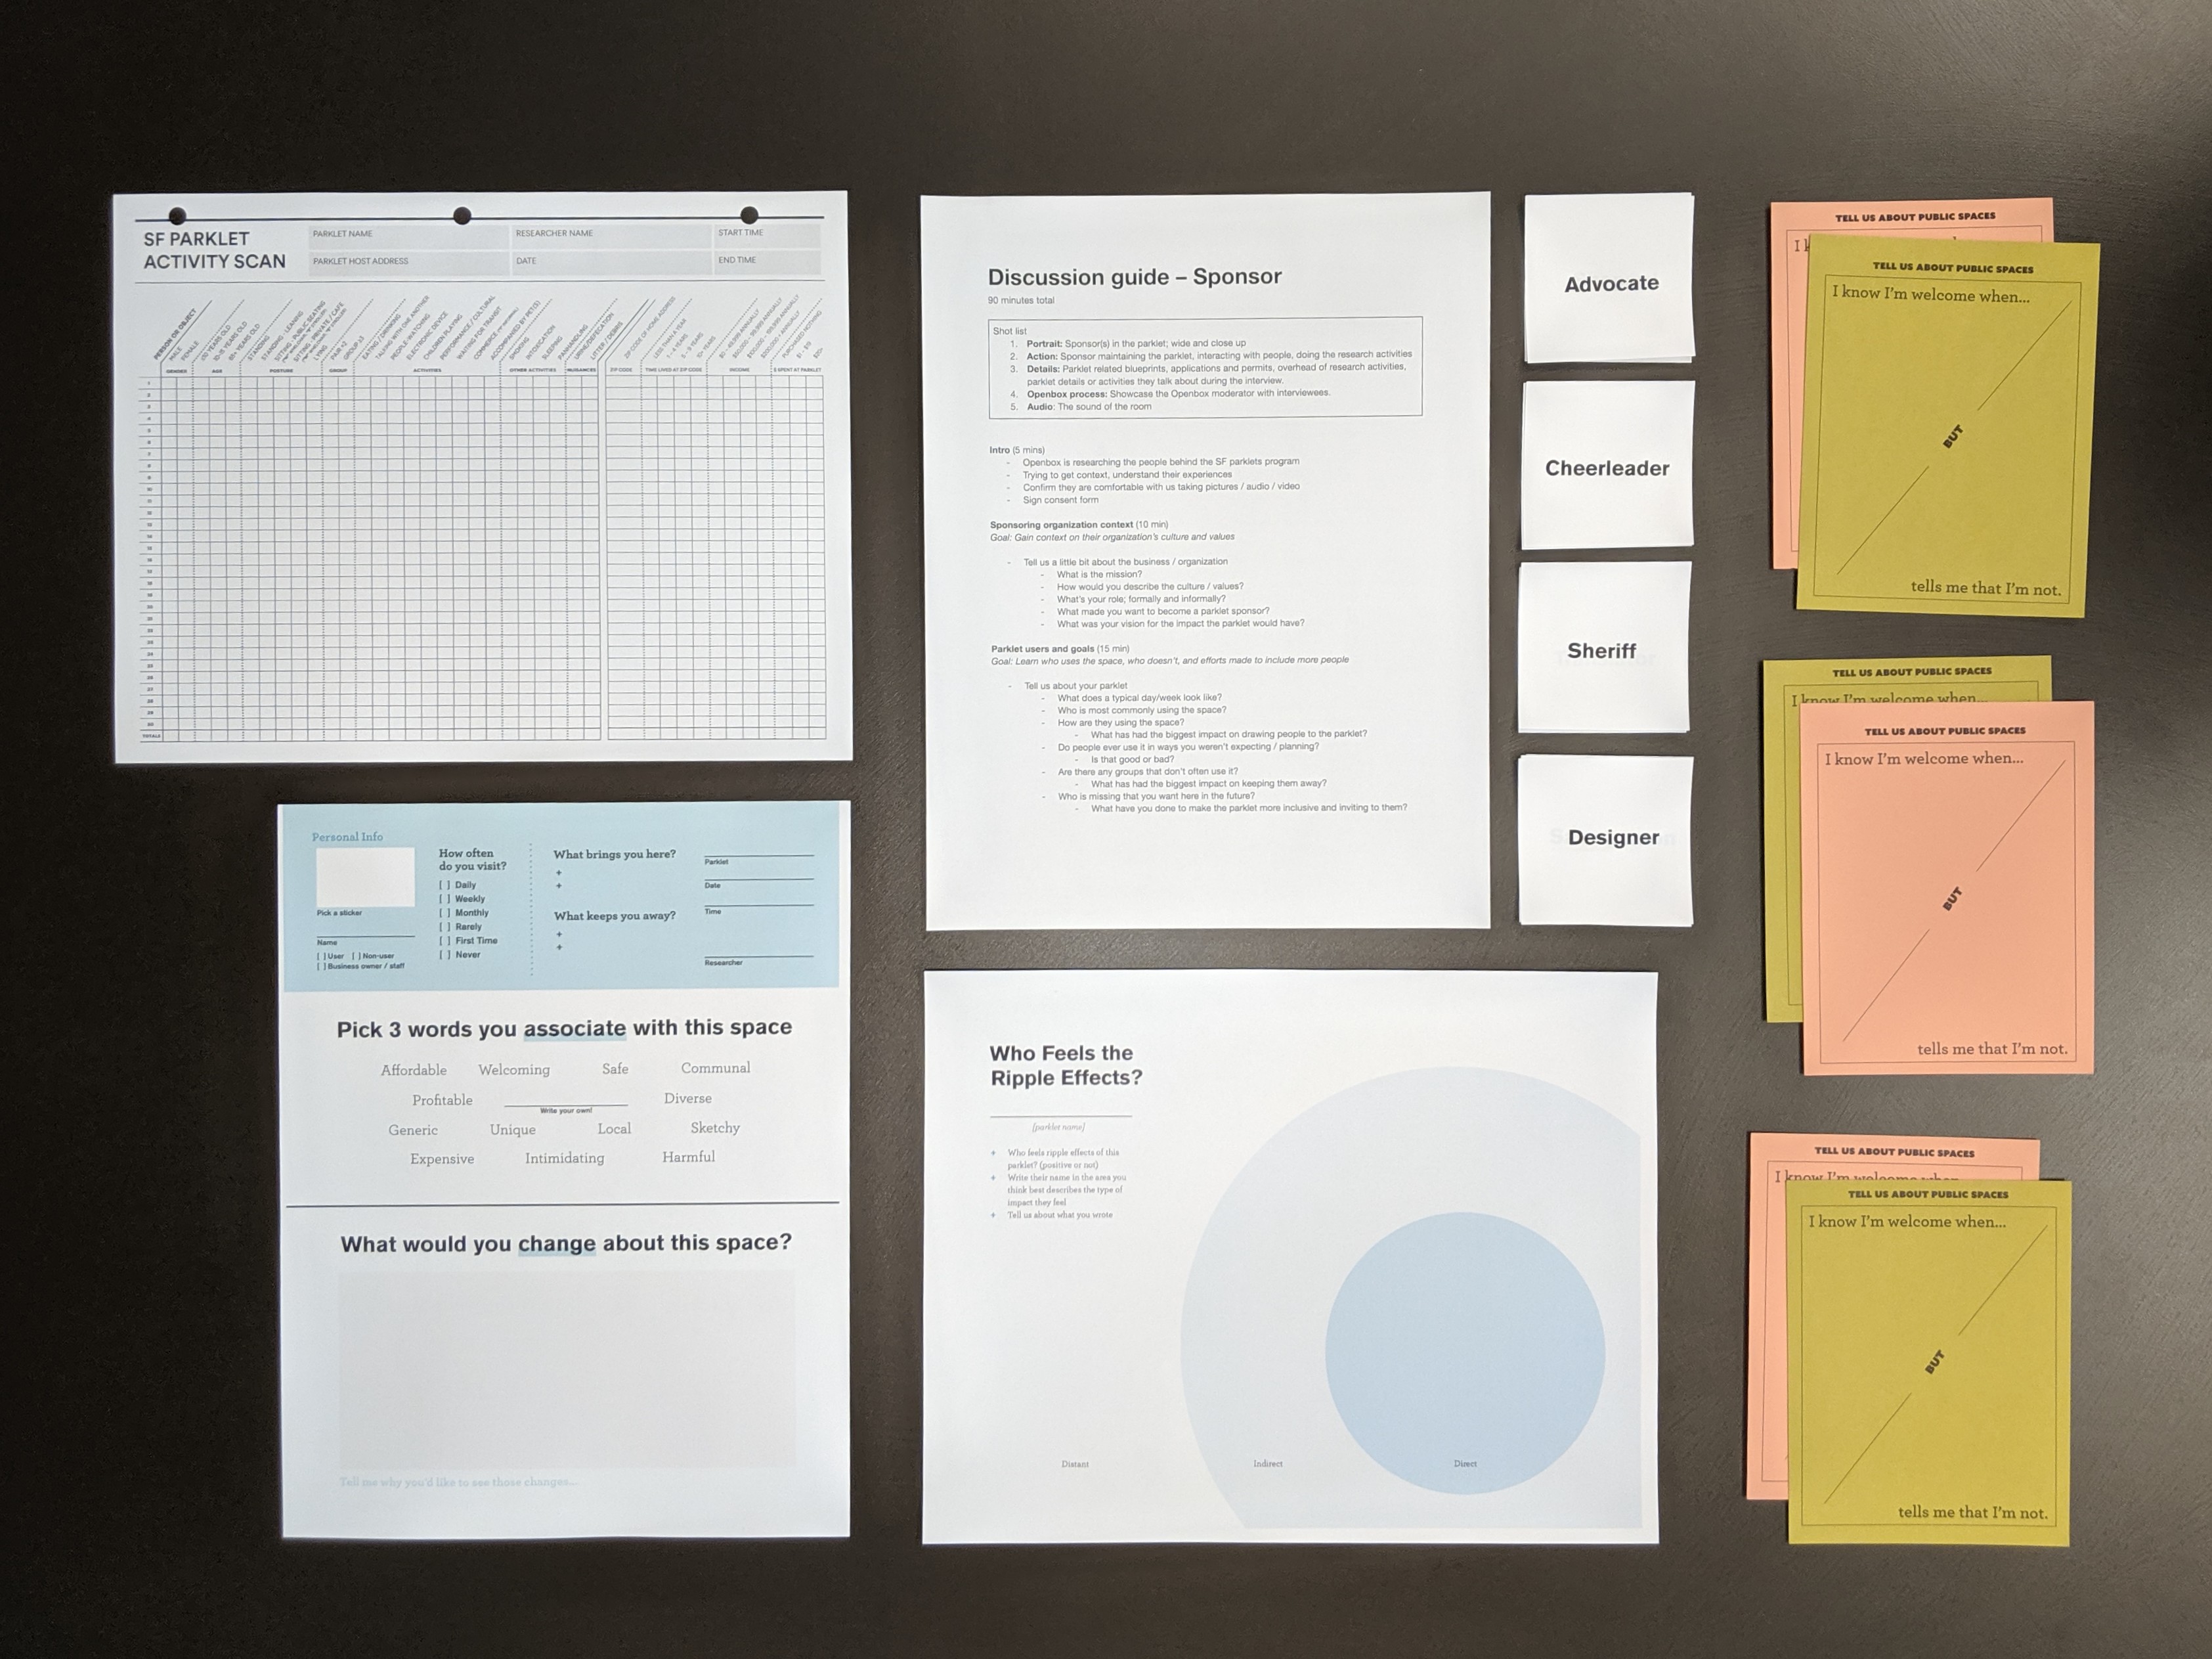
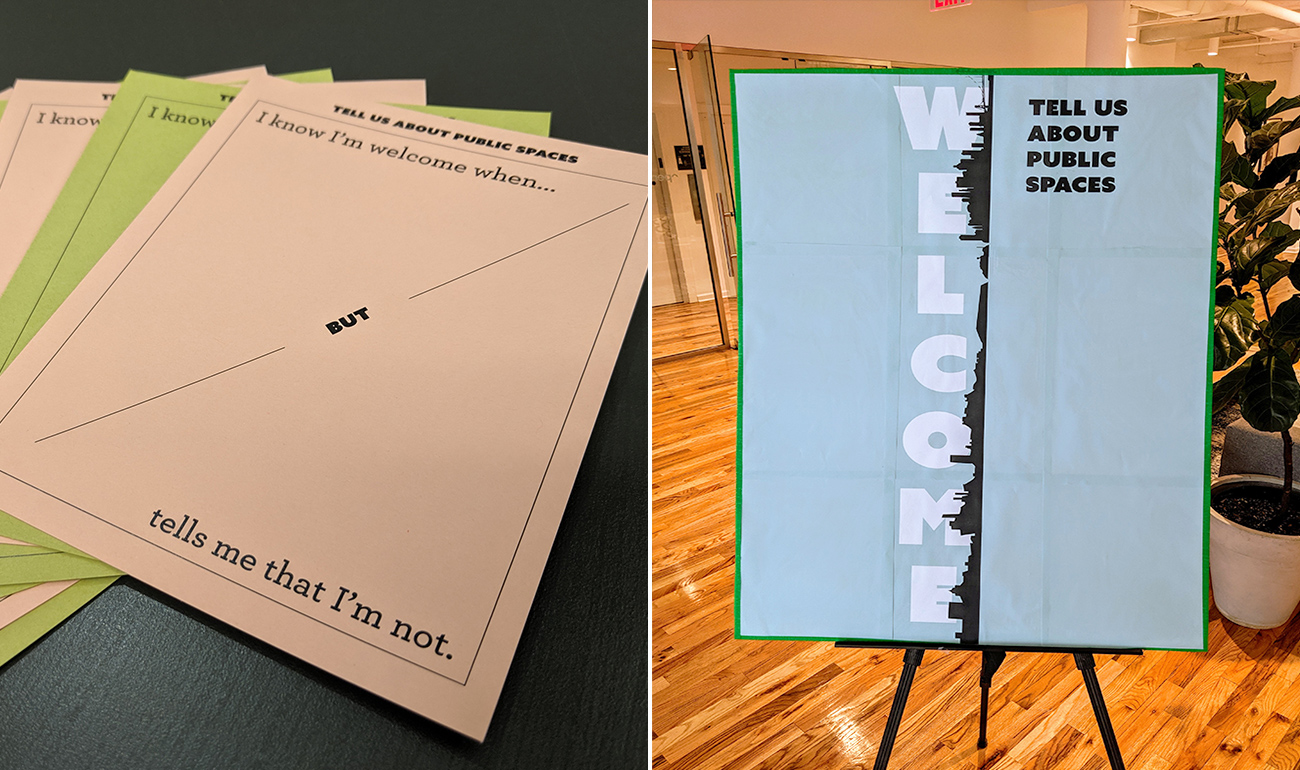
The data from "What are people saying" tab in this section are from intercept surveys carried out by Openbox and Stae in June 2019. These surveys took place at each of the six parklets whose sponsors were interviewed for this study and surveys were designed to approximate the city’s public life study standards manual, with the intent of helping us understand the sentiments of parklet users, passersby, and nearby business owners. The intercept instrument is available at this link.
The data from "What are people doing" tab is from a 2014 study designed by the San Francisco Planning Department to evaluate parklets and plazas. Data was collected in June and July throughout the week during peak afternoon and evening hours. The two survey instruments used in this 2014 study were pedestrian and cyclist counts, taken in 10 minute intervals twice an hour, and stationary activity scans, which categorize different types of postures and activities. The 2014 study helped to inform the of The Public Life Data Protocol (PLDP), which is a set of observation metrics that attempt to illustrate the diversity of activity in public spaces. PLDP is also a data structure for how cities collect and store public activity data. The standard was developed by Gehl Institute and its partners—Gehl, the practice, the Municipality of Copenhagen, the City of San Francisco, and with the support and input from Seattle DOT. PLDP is now open source and its survey instruments are publicly available on GitHub. All of the raw data are available to the public for the first time on Stae. For more information on this study and analysis, see the reports: Citywide Assessment of Parklets & Plazas (Panganiban, Ocubillo, 2014) and Opportunity Mapping (Stroman, 2014).
Section 1: What's a Parklet?
Section 2: Hyper-local Benefits
For this section’s Census data, our approach was to include census tracts that touch a neighborhood walkshed, which is an ⅛ mile buffer (interactive map of buffers) from the center of a parklet. An ⅛ mile buffer is the equivalent of a 3 minute walk. This is a similar neighborhood walkshed used in a public space study that included parklets called Opportunity Mapping (Stroman, 2014). We chose this buffer because we observed a parklet’s impact to be on a hyper-local, block-level scale. Many parklets are on the border of several census tracts and a buffer captures those neighboring tracts. There are a few outliers to this process, such as the parklets on Townsend in SoMA. We represented the demographics for these parklets within the census tract it sits in because of its location and proximity to the San Francisco Bay. Taking a ⅛ mile buffer here would overrepresent access to these parklets because much the census tract extends beyond a walkshed.
Section 2: Hyper-local Benefits
Section 3: The Ripple Effect
For the assessments, affordable housing, and business licenses, the ⅛ mile buffer is used as a geospatial filter. Any points contained in this filter are counted to approximate the “Ripple Effect” for each parklet on its block. Since these datasets contain actual latitude and longitude points, we are able to filter for discrete points within the buffer and then filter by year.
We used turf.js, which is an open source geospatial tool written in javascript, to create the buffers. See this live code sandbox on how this library works with data on Stae. After creating the buffers, we used them as geospatial filters for assessments and affordable housing units in Stae. We then took the sums of each annual assessment, utilizing R Studio to group individual assessments by each block. Finally, we took the sum and mean of each assessment block within the parklet walkshed and plotted them on a year over year line. The source code of this analysis in R is available at this GitHub repository.
Business Licenses were filtered within the parklet buffers using ArcGIS by Meital Hoffman, who is the public life intern at San Francisco City Planning.
Section 3: The Ripple Effect
Section 5: It All Started with Feeding The Meter
Data on parklet permits and installation dates and current status were pulled from the SF Planning Department Records. This data was reproduced manually and uploaded to Stae and is now available to the public in an open, machine readable format for the first time.
Section 5: It All Started with Feeding The Meter
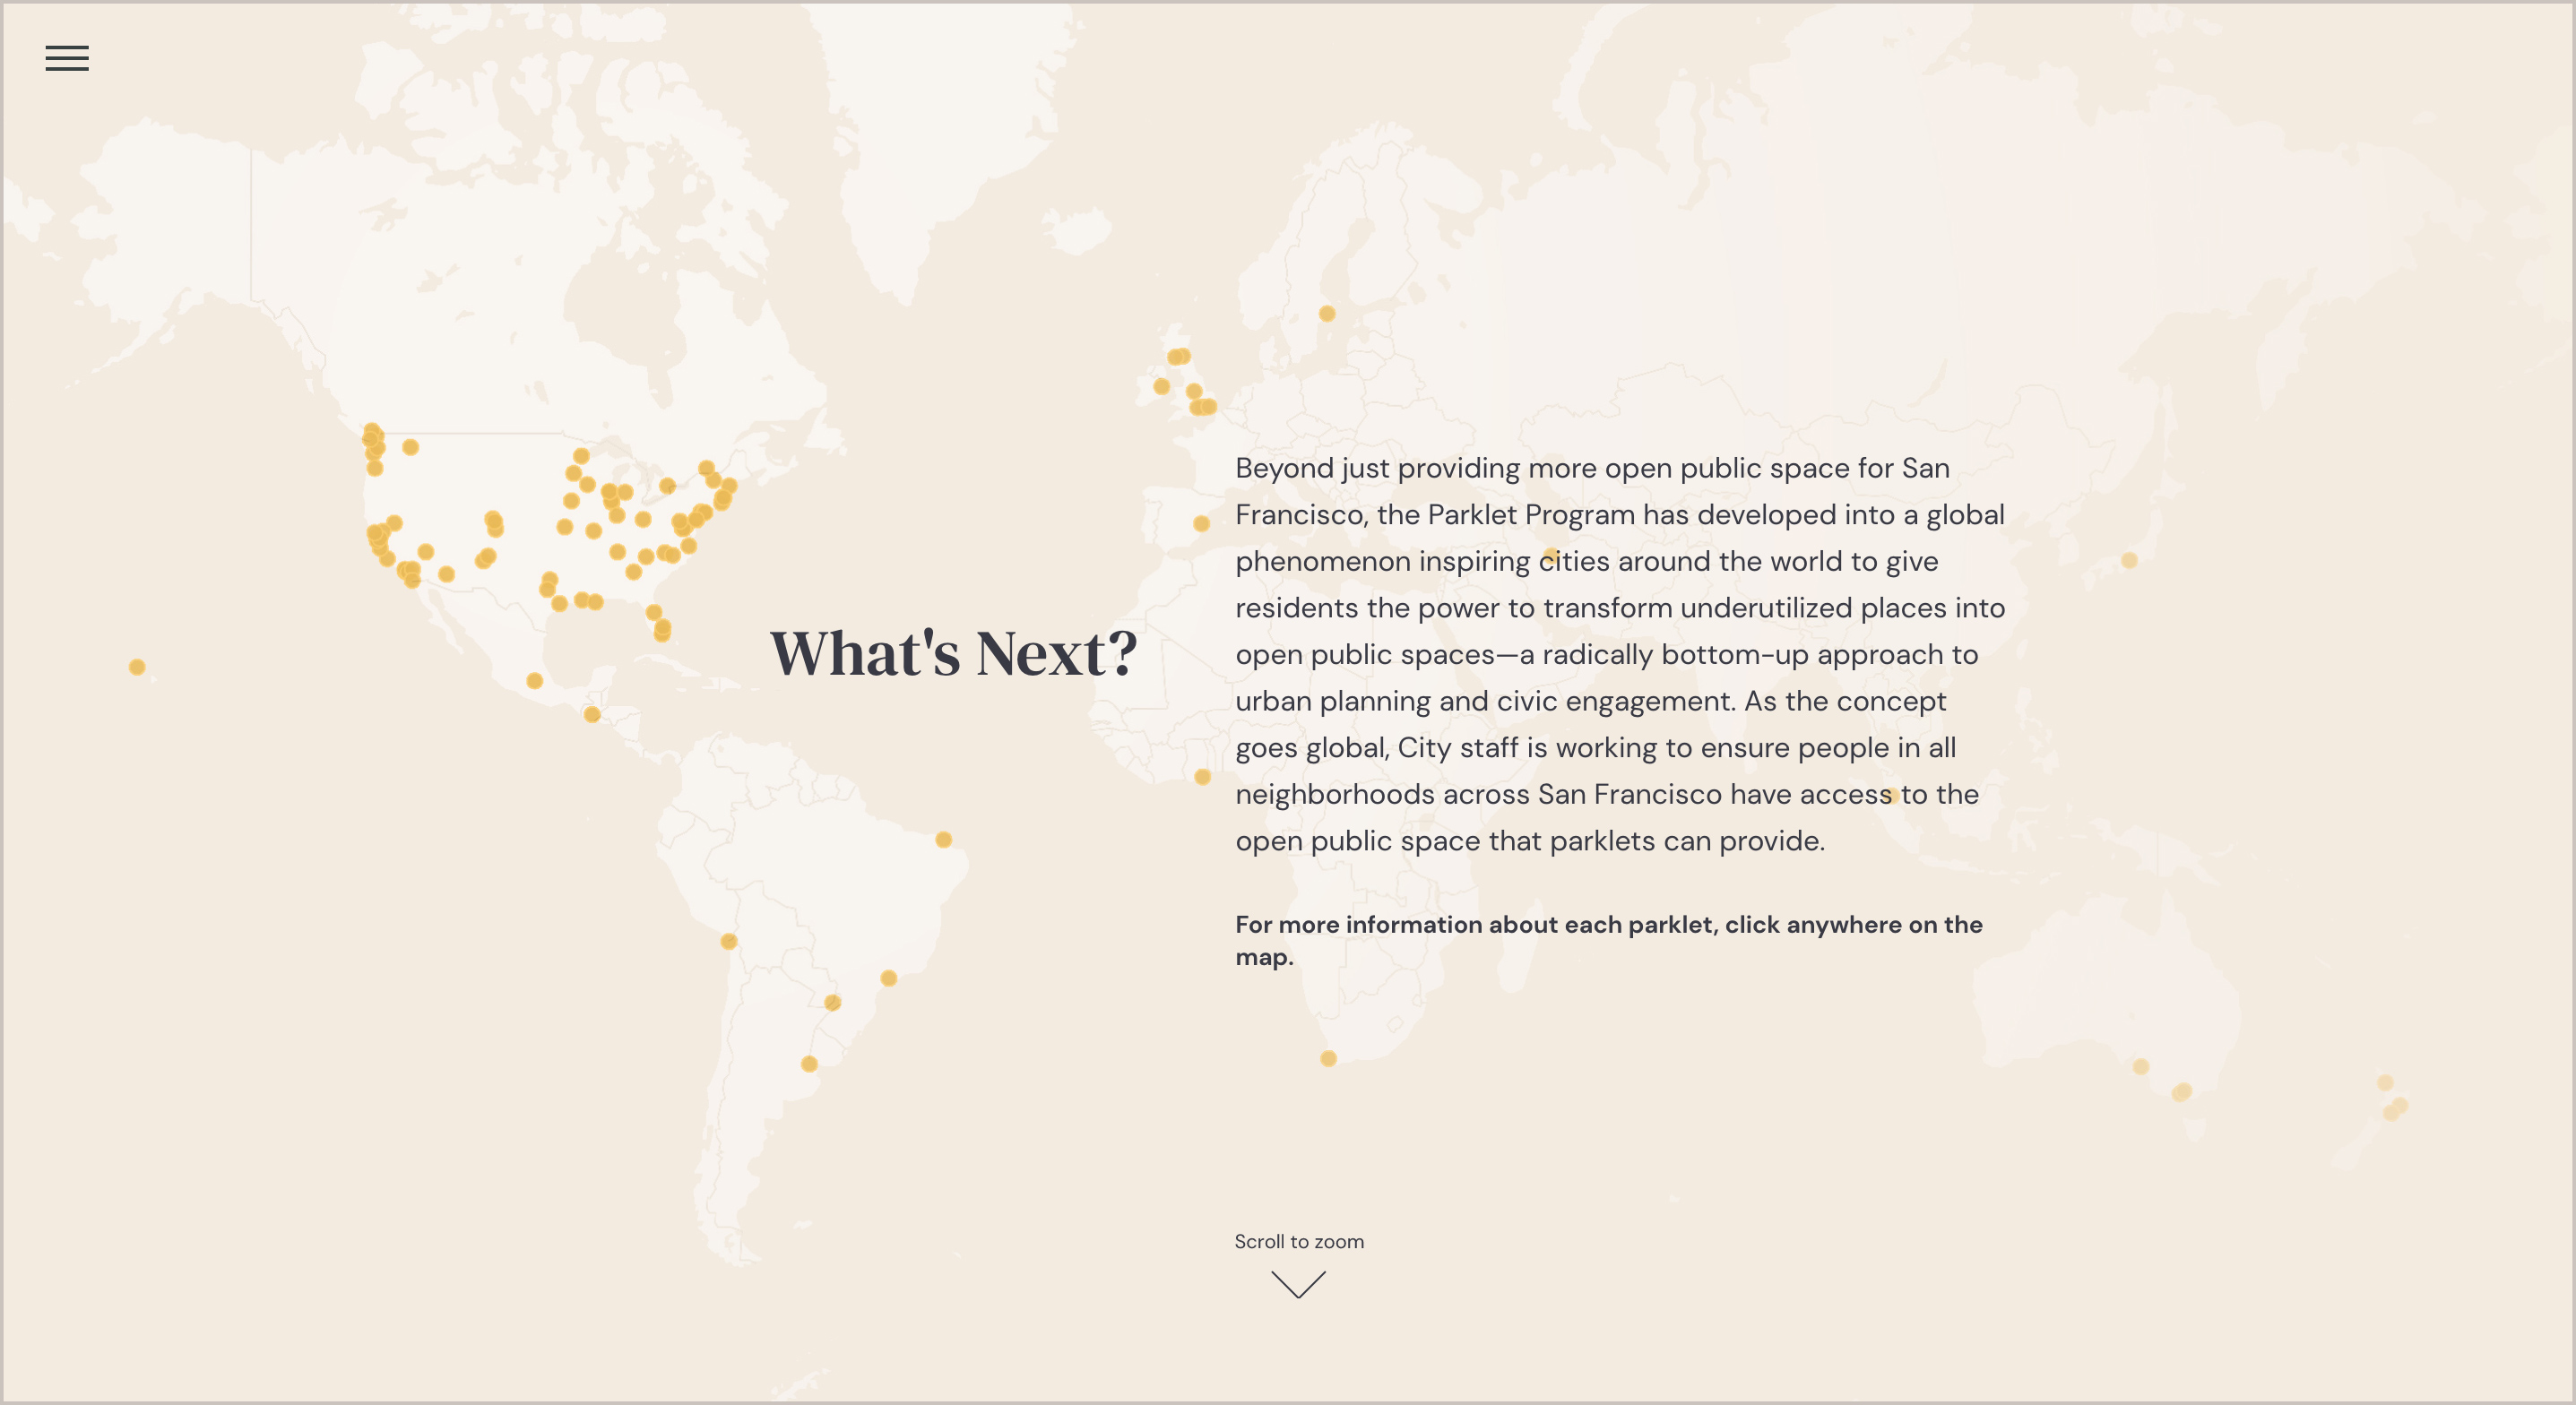
Section 7: What's Next?
Global Parklet data are from San Francisco’s Planning Department. This dataset was incomplete and therefore updated for this data story.
Section 7: What's Next?